
Laboratory Exercise – Repetition
Evaluation Instructions
Anonymous evaluations
Sales Tax Application
Problem Description:
Develop an application that charts of the amount to charge in sales tax for a specific purchase price. The user will enter the percent sales tax to be charged, the limit to display in the chart, and the increment amount for the chart. A purchase price and the associated sales tax should be displayed for every value from 0 to the chart limit, incremented by an amount entered on the form called a chart limit.
Your application should look as follows:

Problem Discussion:
The layout of your application is relatively simple. Your application requires a text box to allow the user to enter a percent sales tax, chart increment, and chart limit. The text boxes should be labeled accordingly. You will need a button to process the outputting of the chart. Finally, you will need a label to display the sales tax chart.
You will require a variable to store each value entered in a text box. Because each value can hold a floating-point number, this variable should be declared as a
Single. While it is not required, it is recommended that you convert the percent sales tax into the sales tax rate by dividing by 100. You should store this value in a separate variable. One last variable is required to act as the loop counter.
When solving this problem, you must decide what type of loop you wish to use. Your choices are a
For loop, Do While loop and a Do Until loop.Let’s examine each choice of loop and decide which is best. Remember, we said in the text that any looping structure can be used in any situation, but one structure will better fit the problem and should be used.
A
A
Do While loop is used when you wish to check an existing condition and process the loop if the condition evaluates to True. You could use a Do While loop if the looping condition was set to (current amount <= chart limit). If the user accidentally entered a negative chart limit, the loop wouldn’t output invalid data, so as long as you coded the loop increment properly, a Do While loop would be a valid looping choice.A
Do Until loop is used when you wish the loop to execute at least once, regardless of the looping conditions evaluation. This would not be acceptable in this case, because if the user entered a chart limit that was less than 0, invalid data would be output from the body of the loop. Indeed, you could check to see if a negative value was entered, but why bother if the Do While loop will handle it for you.Clearly, the best choice is a
Do While loop. The body of the loop is actually quite small. All that is required is outputting the current purchase price and the sales tax associated with it. The sales tax is calculated by multiplying the purchase amount by the sales tax rate. However, remember you must divide the sales tax percentage by 100 to get the sales tax rate. The final step is to increment the current amount by the increment amount.
Problem Solution:
Step 1: Create an Application called
SalesTax.Step 2: Rename the form in the Solution Explorer to
frmSalesTax.vb.Step 3: Change the
Name property of the form to frmSalesTax.Step 4: Change the
Text property of the form to Sales Tax Application.Step 5: Add a label control to the form.
Step 6: Change the
Name property of the label to lblTitle.Step 7: Change the
Text property of the label to Sales Tax Application.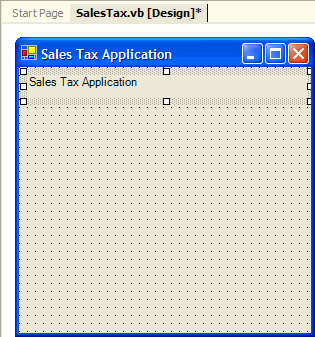
Step 8: Change the
TextAlign property of the label to MidddleCenter.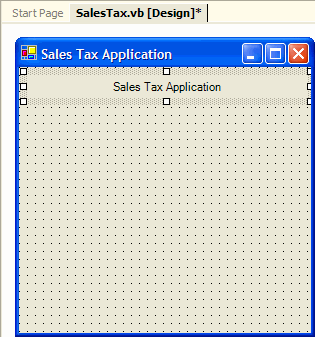
Step 9: Change the
Font Size to 16 and the Bold property to True.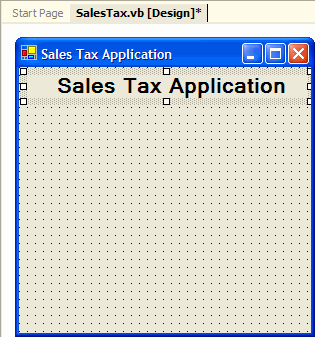
Step 10: Add a label for the Percent Sales Tax text box.
Step 11: Change the
Name property of the label to lblPercentSalesTax.Step 12: Change the
Text property of the label to Percent Sales Tax.Step 13: Change the
Font Bold property to True.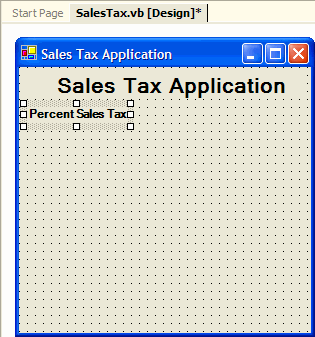
Step 14: Add a text box for the percent sales tax.
Step 15: Change the
Name property of the label to txtPercentSalesTax.Step 16: Clear the
Text property.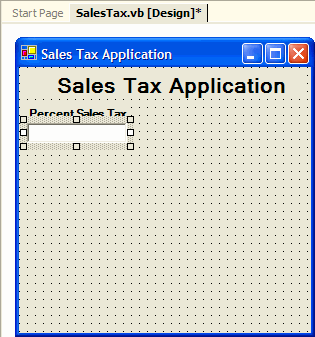
Step 17: Add a label for the chart increment text box.
Step 18: Change the
Name property of the label to lblChartIncrement.Step 19: Change the
Text property of the label to Chart Increment.Step 20: Change the
Font Bold property to True.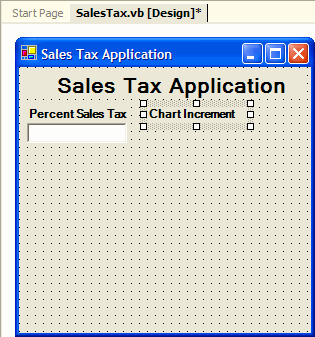
Step 21: Add a text box for the chart increment amount.
Step 22: Change the
Name property of the label to txtChartIncrement.Step 23: Clear the
Text property.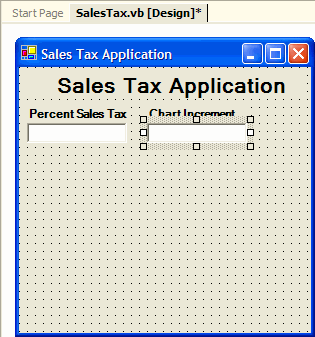
Step 24: Resize the form so that another label control will fit.
Step 25: Recenter the title label.
Step 26: Add a label for the chart limit text box.
Step 27: Change the
Name property of the label to lblChartLimit.Step 28: Change the
Text property of the label to Chart Limit.Step 29: Change the
Font Bold property to True.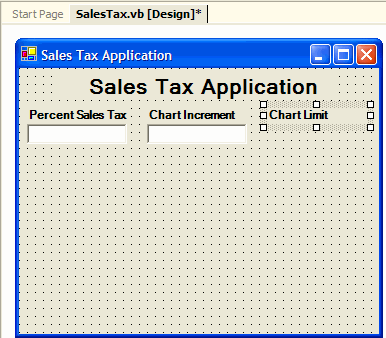
Step 30: Add a text box for the chart limit amount.
Step 31: Change the
Name property of the label to txtChartLimit.Step 32: Clear the
Text property.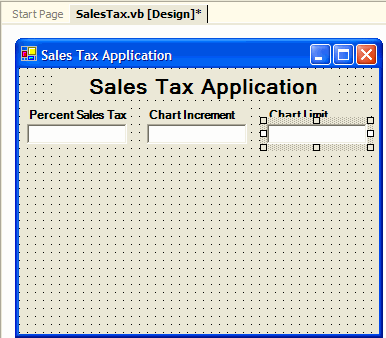
Step 33: Resize the form again so that a large label can be placed for the output.
Step 34: Add a label for the output of the chart.
Step 35: Change the
Name property of the label to lblSalesTaxChart.Step 36: Clear the
Text property of the label.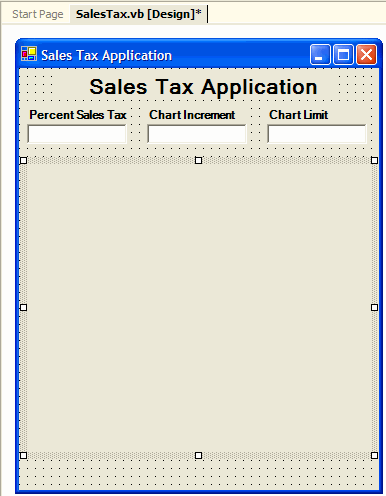
Step 24: Add a button to the form.
Step 25: Change the
Name property of the button to btnOutputChart.Step 26: Change the
Text property of the button to Output Chart.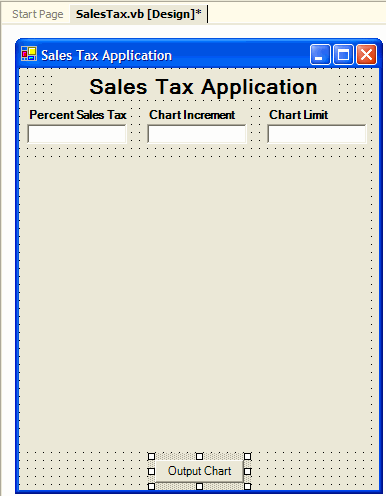
Step 30: Add the declaration of the variables to store the total payrolls of each department.
Step 31: Add the code to the button’s
Click event. Follow the algorithm presented in the problem discussion.