 |
 |
 |
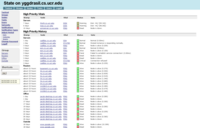
| Main screen for the web interface that greets users who login. Displays recently changed vital history for high priority groups. |
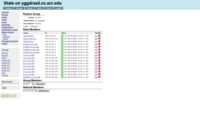
View the details of a Group, all of the nodes inside and brief uptime information. Allows adding and removing nodes. |
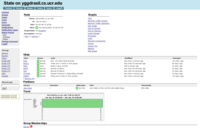
View details for a given Node, including all available graphs, vital information, and a basic trend display. |
 |
 |
 |
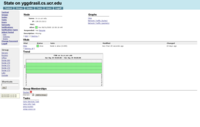
| Simplified node view for nodes lacking the amazing details in the previous screen. |
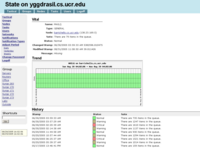
View for the details of a particular vital, includes history and the trend view for the selected time range. |
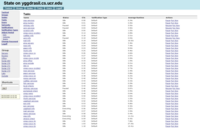
All of the tasks, including their scheduling information, sorted by estimated time until running. Users can pause and activate tasks from here. |
 |
 |
 |
| View details for a specific Task, including the queries to be performed and the groups/nodes that are to be acted upon. |
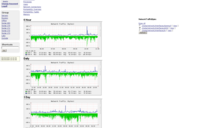
Graphs of the network connections for a particular node. |
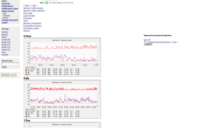
Graphs of the network traffic for a particular node. |
 |
|
|
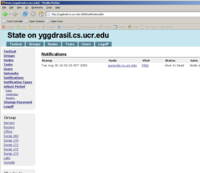
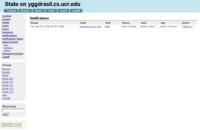
| Pending notifications that have been triggered and the type of notification, which governs how e-mails are dispatched and when they stop, etc... |
|
|